Liquidation Heatmap Trading Explained
⏱ 5 min read
- A liquidation heatmap visualizes clusters of liquidation levels across price zones, helping you spot where big moves might trigger cascading liquidations.
- It’s most effective when combined with support/resistance levels and volume analysis — using it alone can lead to false signals.
- Focus on high-density areas near current price; these zones often act as magnets or reversal points in volatile markets.
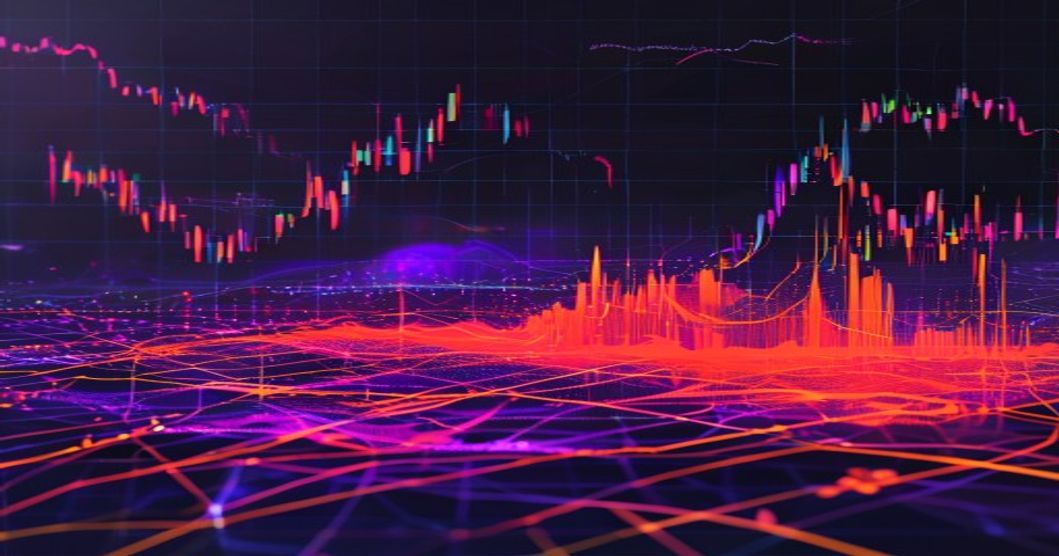
You’re watching a chart, and price starts ripping toward a dense red zone. Your gut says it’s going to reverse — but it doesn’t. Sound familiar? That’s the liquidation heatmap showing you exactly where leveraged positions are stacked. It’s one of the most talked-about tools in crypto futures right now. But here’s the thing: most traders misuse it. Let’s fix that.
What Is a Liquidation Heatmap Indicator?
A liquidation heatmap is a visual representation of liquidation levels across different price points in the perpetual futures market. It aggregates data from exchanges like Binance, Bybit, and OKX to show where large clusters of long or short positions would be liquidated if price moves to those levels. Think of it as a thermal map of market pain — the hotter the zone, the more leveraged capital is at risk.
These heatmaps aren’t just random blobs. They’re built from real-time open interest and leverage data. When price approaches a dense cluster, two things can happen: either it gets rejected (liquidity grab) or it plows through, triggering a cascade of forced closures. According to CoinDesk, cascade events have caused single-day losses exceeding $1 billion in crypto futures.
Most platforms color-code the zones — red for high density, blue or green for low. The key is understanding that these zones shift constantly as traders open and close positions. A heatmap from 10 minutes ago might already be outdated.
How Does a Liquidation Heatmap Work in Crypto Futures?
Here’s the mechanics. Exchanges calculate liquidation prices based on entry price, leverage, and margin mode. For a 10x long on Bitcoin at $60,000 with isolated margin, the liquidation price is roughly $54,545. Aggregators collect millions of these data points and plot them on a price axis. The result? A heatmap that shows where the most leveraged positions sit.
But there’s a nuance. Not all liquidation clusters are equal. A cluster of 100 small traders with 5x leverage matters less than 10 whales with 50x leverage. Quality heatmaps weight by notional value, not just count. That’s why you’ll see some zones glow brighter — they represent bigger dollar amounts at risk.
Let’s look at a real scenario. Say Bitcoin is trading at $65,000. Your heatmap shows a dense red zone at $62,000 (long liquidations) and another at $68,000 (short liquidations). Price drops to $62,500 and bounces. That’s a liquidity grab — the market swept into the zone, triggered some stops, and reversed. But if price breaks below $62,000 with volume, expect a cascade toward $60,000 or lower.
For more on managing these volatile moves, see Cosmos ATOM Futures Pivot Point Strategy.
Why Should You Use a Liquidation Heatmap for Trading?
Because liquidation zones act as magnets or trapdoors. In a trending market, price tends to hunt these clusters before continuing. In a ranging market, they become resistance or support. Here’s why that matters:
- Entry timing: You can wait for price to reach a high-density zone and look for confirmation (candlestick patterns, volume spike) before entering.
- Stop placement: Place stops just beyond major liquidation clusters to avoid being caught in a sweep.
- Profit targets: If you’re short, consider taking partial profits near a dense long-liquidation zone — that’s where buying pressure might emerge.
A study from Investopedia on market microstructure notes that stop-loss cascades account for roughly 12% of intraday volatility in highly leveraged markets. Crypto futures, with their 100x leverage options, amplify this effect dramatically. So ignoring liquidation data is like driving blind in a storm.
But I’ve seen traders blow accounts chasing every heatmap signal. The heatmap shows where liquidations could happen, not where they will happen. You need confluence. Combine it with order flow, volume profile, or trendlines. For a deeper dive, check Jito JTO Futures Order Block Strategy.
Can You Trade With a Liquidation Heatmap Alone?
Short answer: no. And here’s why. Liquidation heatmaps are reactive, not predictive. They show existing positions, not future intent. A dense zone might never get tested if the market gaps over it. Or it might get tested and hold, then get tested again and break. You don’t know which until it happens.
I learned this the hard way. In early 2024, I saw a massive long-liquidation cluster on Ethereum at $2,800. Price dropped to $2,810, bounced, and I entered a long. But it was a fakeout — the second sweep took it to $2,750, liquidating my position. I’d ignored that the cluster was building in real time as more longs opened. The heatmap was accurate, but my interpretation was wrong.
So use the heatmap as one piece of a puzzle. Here’s a simple framework:
- Identify the nearest high-density zone (within 2-3% of current price).
- Check if price is approaching with increasing volume.
- Look for divergence on RSI or MACD.
- Place a limit order near the zone edge, not the center.
- Set a stop 0.5-1% beyond the zone.
This approach won’t win every trade. But it tilts the odds in your favor — and in futures trading, that’s everything.
FAQ
Q: Do liquidation heatmaps work for all timeframes?
A: They work best on shorter timeframes (1-minute to 1-hour) where liquidation data updates frequently. On daily or weekly charts, the clusters become too broad to be actionable. Stick to intraday trading for maximum relevance.
Q: Are liquidation heatmaps available on all exchanges?
A: Most major exchanges don’t provide native heatmaps — they’re offered by third-party tools like Coinalyze, Hyblock Capital, or TradingView. These aggregate data from multiple exchanges so you see the full picture, not just one order book.
So Where Do You Go From Here?
You’ve got the tool. Now the question is whether you’ll use it as a crutch or a scalpel. The best traders I know treat liquidation heatmaps like weather radar — they check it, respect it, but never let it override their core strategy. Start small. Paper trade with a heatmap for a week. See how price interacts with those red zones. Then, when you’re ready to go live, keep your risk tight. Because in crypto futures, the market doesn’t care about your analysis — it only cares about your stop-loss. Ready to level up your edge? Check out Aivora AI Trading signals for real-time insights that complement your heatmap analysis.